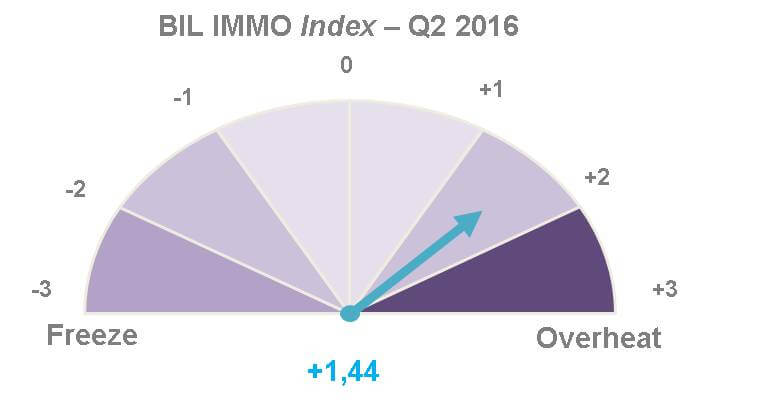
The BIL IMMO Index stood at +1.44 in Q2 20161, up from +0.93 in Q4 2015. Its change indicates a clear upswing in the national housing market since the beginning of the year. Explanations include further price rises, a sustained increase in homebuilding, and growth in the volume of lending.
"Property prices rose by 5.6% between Q2 2015 and Q2 2016. Rents also climbed, but at a much slower pace. The increase in the BIL IMMO Index reflects this market upswing driven by the Centre South region," said Marcel Leyers, Chief of Corporate and Institutional Banking at BIL.
"Current low interest rates are helping to fuel strong demand. On the supply side, 2,471 building permits were issued in the first half of 2016, compared with 1,827 over the first half of 2015. If this growth were to continue, it could ease house-price inflation and bring the index back towards its equilibrium."
Launched in October 2015 and developed by BIL in partnership with PwC Luxembourg, the BIL IMMO Index illustrates the housing market trend in Luxembourg to professional, institutional and retail investors.
Updated regularly and published every six months, the index is based on price changes on the selling and rental markets, as well as factors underlying supply and demand such as the national economy, construction activity and demographic change. A total of seven ratios are synthesised to produce the BIL IMMO Index, an easy-to-interpret indicator that gives an overview of the last 35 years on the Luxembourg housing market.
Find full analyses by region at www.bil.com/immoindex and in BIL branches.
1The index runs on a scale of -3 to +3 and reads the temperature of the market. At +3, the maximum level, the market is thought to be “overheating”. At the other end of the scale, a negative index means that the market is lacklustre, and a level of -3 indicates a stagnant, “frozen” market.